...
Clicking on bars or table will show issues that were closed by given actor (in selected data range).
History

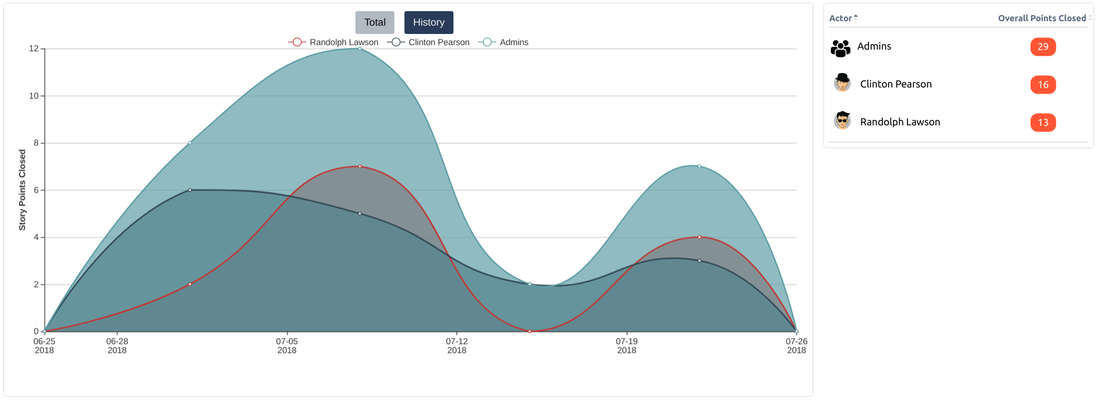
Values in table on right side still show total values when this chart type is selected. Clicking on datapoint will show issues that were closed by given actor in given week.