Introduction
There’s no doubt that tracking team member performance is important. By using our plugin you have access to most important metrics in one place.
User Interface
In order to show a measure for a given user or team, you will need to select the date range, the Project or Filter and the measured actors themselves.
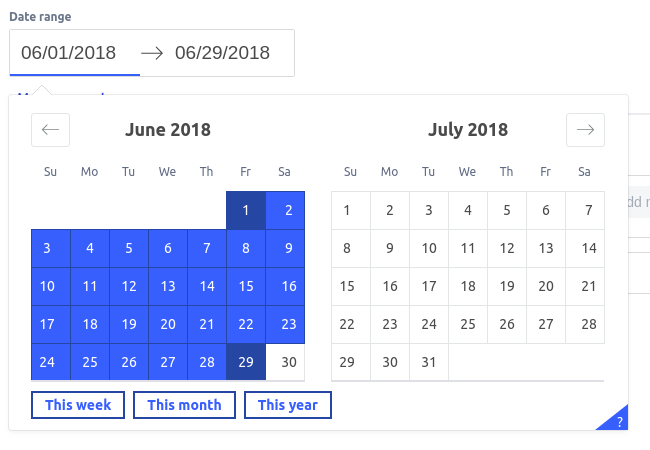
Data range
First you will need to select the date range for which you want to display the measure. Only tickets updated in the given time period will be taken into consideration.
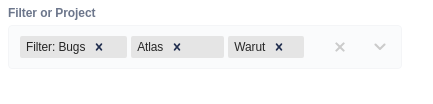
Filter of Project
You can also optionally choose a project or one of your favourited filters to control which tickets will be used for the calculation. Filters and projects can be combined - the measure will work on their sum.
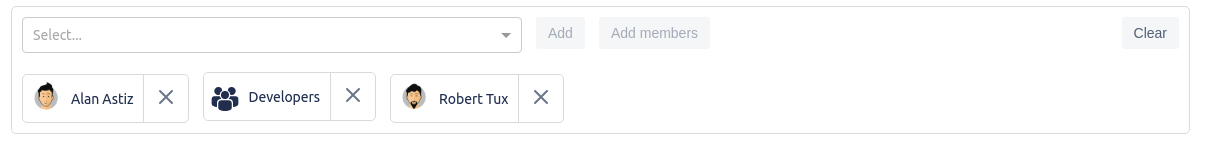
Actor selector
Finally, you will need to select the actors that will be measured. You can select both users and groups. If you select a group, the measure will be calculated for the group as a whole - this will give you the abillity to compare whole teams. It is also possible to add all members of a group - in that case each of them will be measured individually.
Measurements
We currently support the following measures:
Charts
Depending on measurment, one or two types of charts will be available when you select date range and actors:
- Bar chart - shows total value - one bar for every actor
- Line chart - shows how the value changed over time - one line for every actor
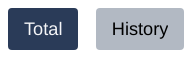
You can change chart type by pressing a corresponding button above chart: